SUMMARY
US interest rate peaks have often shaped returns for investors in key asset classes. History suggests likely gains for shares and fixed income.
Key takeaways
After steep rate hikes from the US Federal Reserve, many investors expect cuts this year
Historically, the period after rate peaks has boosted some markets
Treasuries have risen most consistently, with US equities gaining too
Some equity sectors have done better than others amid these periods
It's been the most aggressive campaign of Fed interest rate hikes since the early 1980s.
In less than a year-and-a-half from March 2022, the US central bank raised the federal funds target rate from around zero to 5.25%.
While we cannot be sure the hikes are over, investors are now trying to determine when and how much the Fed might finally cut rates.
This exercise, however, is fraught with difficulty, as the experience of recent months has shown.
But while the timing and extent of cuts remains unclear, history may offer clues as to how financial markets might perform in anticipation of and during rate reductions.
How do interest rates affect bonds?
Lower rates tend to boost bond prices.
Since 1974, there’ve been eight notable interest rate cutting cycles – figure 1.
Figure 1. Half a century of US rate cutting cycles

Source: Bloomberg, as of 3 May 2024.
These include the famous 1981-83 episode where the federal funds target rate tumbled from a record 20% to 9.5%.
On average, the gap between the last rate hike to the first cut has been 7 months, with a minimum of one month and a maximum of 15.
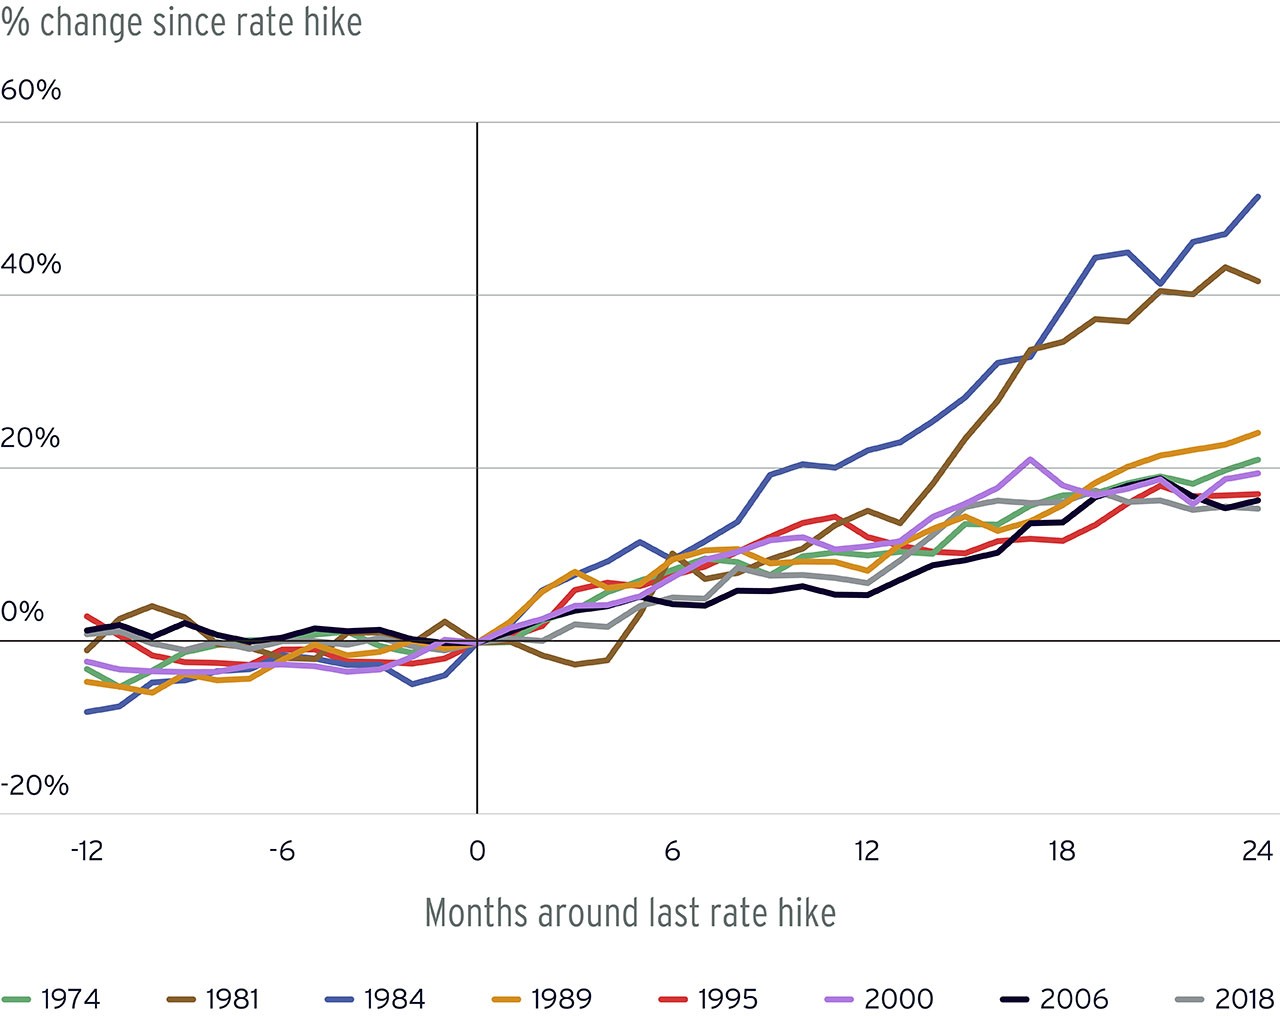
In all those eight rate reduction cycles, US Treasuries have historically delivered positive returns in the 24 months following the peak in interest rates.
This makes intuitive sense. After all, interest rates and bond prices have an inverse relationship: falling rates tend to see rising bond prices.
Figure 2 shows total returns from the US Treasury Index in the twelve months before and the twenty-four months after peaks in rates.
FIGURE 2. Treasuries have taken off after rate peaks

Source: Citi Wealth Investment Lab, Bloomberg. Monthly data from 1 January 1973 to 31 January 2024. Indices are unmanaged. An investor cannot invest directly in an index. They are shown for illustrative purposes only and do not represent the performance of any specific investment. Index returns do not include any expenses, fees, or sales charges, which would lower performance. See Glossary for definitions. Past performance is no guarantee of future results. Real results may vary.
Of course, not all bonds respond to the same extent when rates decline.
Those with higher duration – the measure of sensitivity to rate moves – have typically seen stronger performance.
How have equities done around peak rates?
The advent of peak rates has also impacted equity performance.
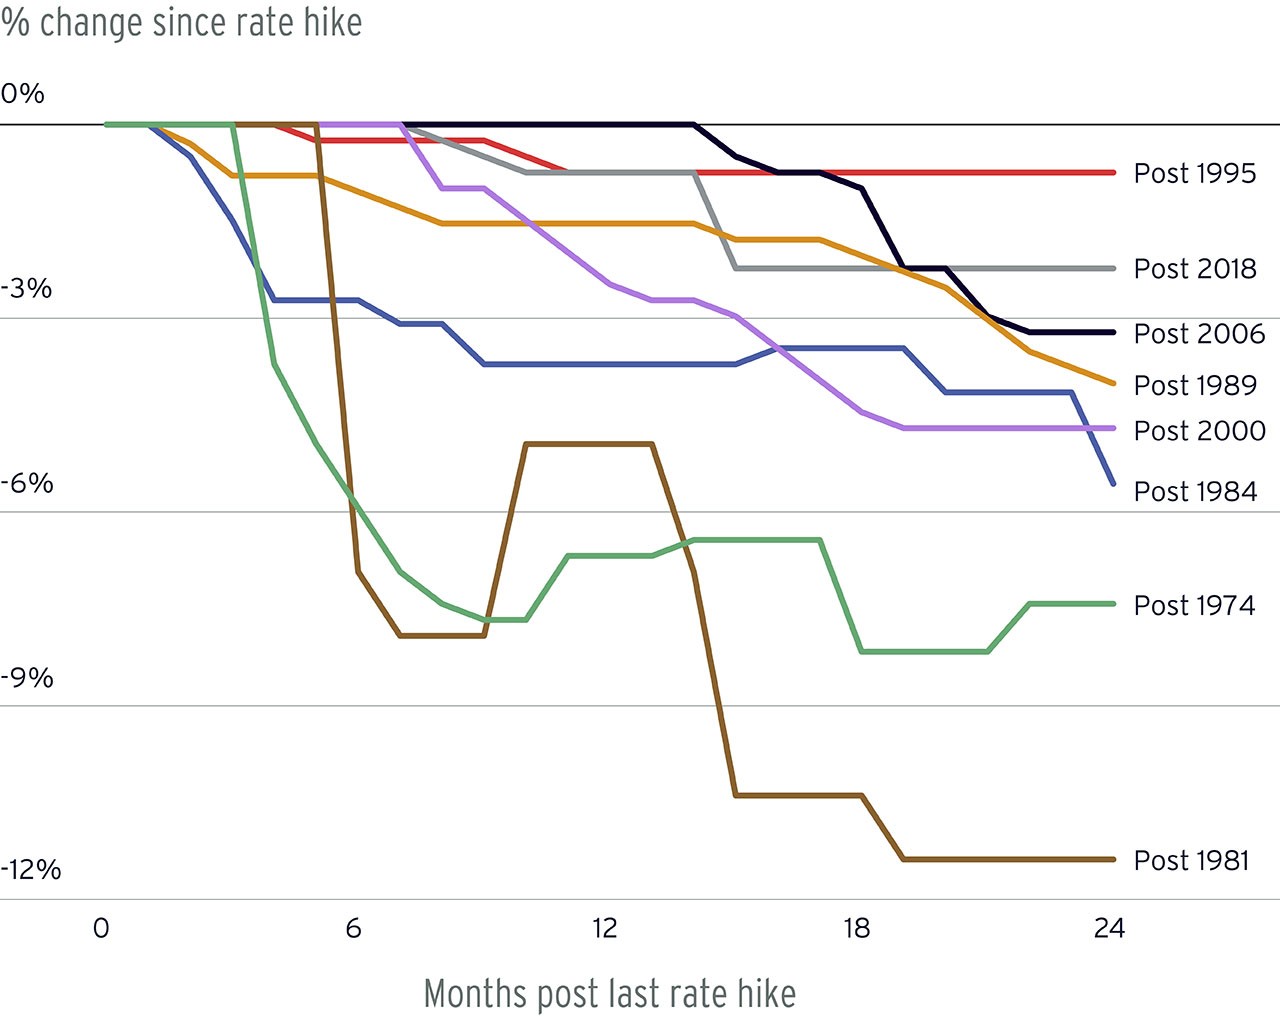
The S&P 500 Index has produced gains more often than not as the fed funds rate has reached its cyclical apex.
In all but two cases in the past eight episodes, total returns over the 24 months after the peak were 20% or greater.
This too is what we might expect. Cheaper money is helpful for many businesses while also increasing the value of their future earnings in investors’ eyes.
The strongest upside has come when rate cuts were not associated with a US recession.
The standout exception was the peak following the dotcom bubble of the late 1990s.
Back then, US equity valuations reached unprecedented highs before beginning a painful downtrend between 2000 and 2002.
While the trend for equities overall has been positive, no industry sector seems to have consistently outperformed – figure 3.
Sector |
1995 - 1997 |
2000 - 2002 |
2006 - 2008 |
2018 - 2020 |
|---|---|---|---|---|
S&P 500 Index |
62% |
-25% |
1% |
50% |
Consumer Staples |
85% |
32% |
16% |
41% |
Energy |
57% |
-3% |
60% |
-26% |
Health Care |
99% |
-3% |
5% |
37% |
Utilities |
31% |
-16% |
34% |
27% |
Communication Services |
45% |
-52% |
11% |
64% |
Consumer Discretionary |
37% |
-11% |
-13% |
71% |
Financials |
109% |
9% |
-34% |
30% |
Industrials |
67% |
-11% |
2% |
44% |
Information Technology |
98% |
-63% |
16% |
116% |
Materials |
43% |
18% |
38% |
50% |
Real Estate |
-1% |
26% |
Source: Citi Wealth Investment Lab, Bloomberg. Monthly data from 1 January 1995 to 31 January 2024. Indices are unmanaged. An investor cannot invest directly in an index. They are shown for illustrative purposes only and do not represent the performance of any specific investment. Index returns do not include any expenses, fees, or sales charges, which would lower performance. See Glossary for definitions. Past performance is no guarantee of future results. Real results may vary.
In the four hiking cycles for which S&P data exists, information technology, consumer staples and healthcare outperformed on three of four occasions.
But there appears to have been no clear pattern favoring cyclical or defensive sectors after peaks.
The challenges of investing around peaks
Over the past half century, being invested in the S&P 500 Index and US Treasuries has been especially worthwhile in the wake of the fed funds rate topping out.
The average 24-month return for each has been 26.7% and 25.8% respectively, compared to a typical 24-month return of 20.2% and 13.8% for the fifty-year period as a whole.
However, there are caveats for investors.
First, seeking to maximize the benefits would have required perfect foresight.
After all, it only becomes obvious sometime after the event that interest rates have indeed peaked.
By the time that the first cut has arrived, equities and bonds may both have already priced in much of the anticipated boost from falling rates.
As of May 2024, there are widespread hopes that the Fed may indeed have completed hiking last July.
However, the US economy has subsequently surprised investors with its strength, while inflation hasn’t retreated by as much as expected.
While perhaps improbable, there’s a risk that rates may rise further, particularly if the economy were to power ahead further or inflation to surge.
Another consideration, as ever, is that this time may not resemble the past.
As that 2000-02 episode highlighted, equities can behave very differently to what previous experience might suggest.


